Trend Over Time
Weekly crawl history per domain — total issue delta charted over time to track SEO health improvements or regressions.
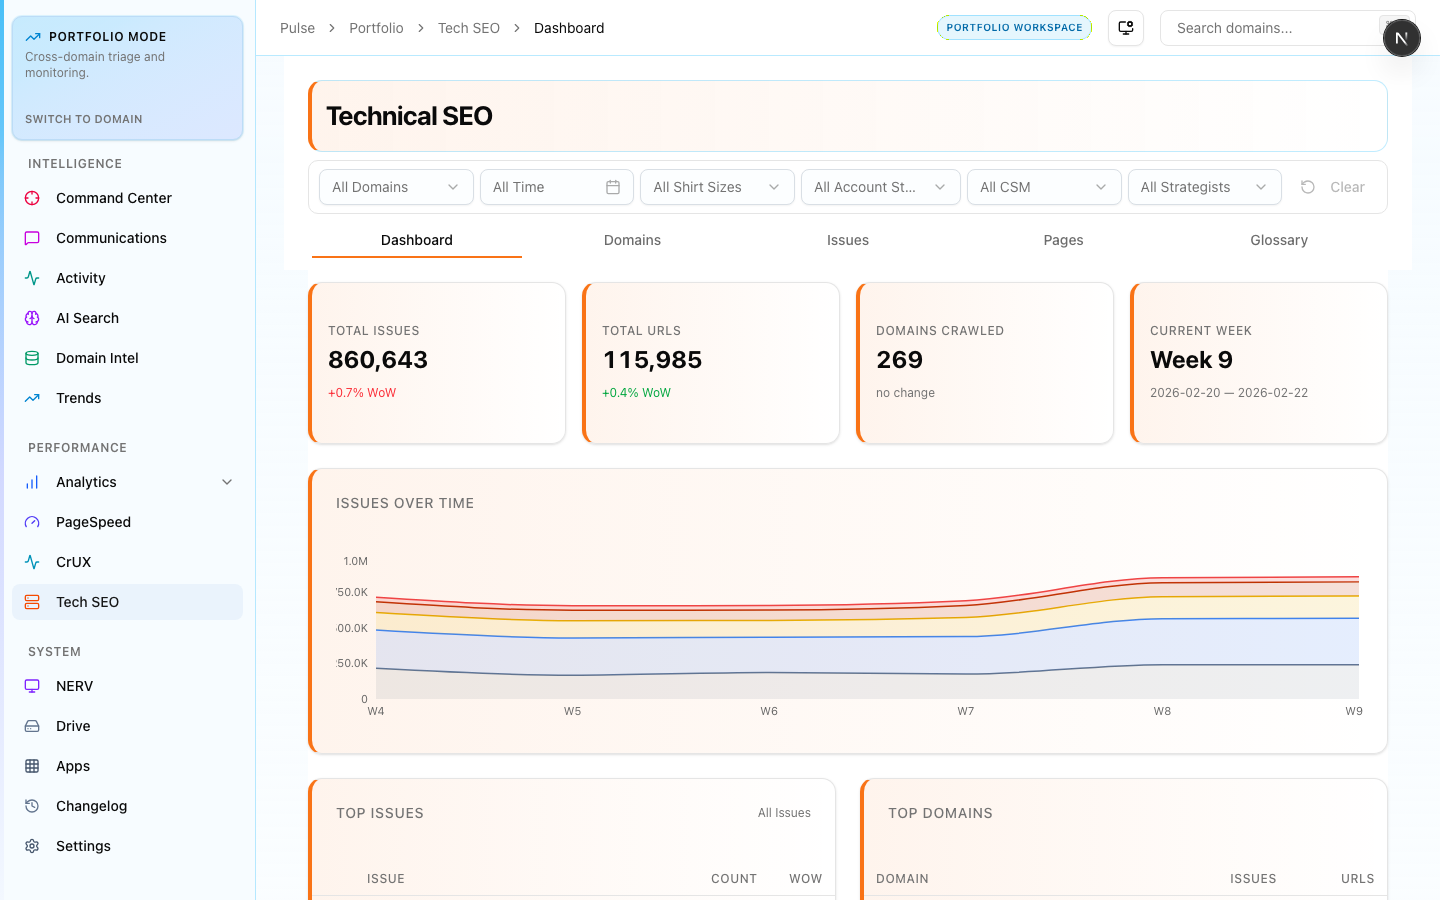
What It Shows
The Trend Over Time view charts the total issue count for a domain across every weekly crawl in the pipeline's history. The chart shows the absolute issue count per crawl and the week-over-week delta as a separate line.
This view answers: "Is this domain's technical SEO getting better or worse over time?"
Reading the Trend Chart
A healthy trend shows a steady downward slope in total issues — indicating that the technical team is resolving more issues than are being introduced. Ideal state is a low, stable floor as issues are fixed faster than new ones appear.
Common patterns to watch for:
- Sudden spike — a deployment introduced a large batch of new issues (broken links, missing meta from CMS template change)
- Plateau — issues are being resolved but new ones keep appearing at the same rate; investigate the source
- Sustained decline — technical SEO work is effectively reducing the issue backlog
Using Trends for Client Reporting
The trend chart is exported for quarterly business reviews to demonstrate technical SEO progress. A downward trend over 90 days is strong evidence of meaningful technical work.
If a domain's trend is flat or rising despite active work, it may indicate a CMS or hosting change introducing recurring issues that need a structural fix rather than one-off remediation.