Location Performance
Per-location GBP analytics breakdown — compare search visibility and engagement across individual practice sites.
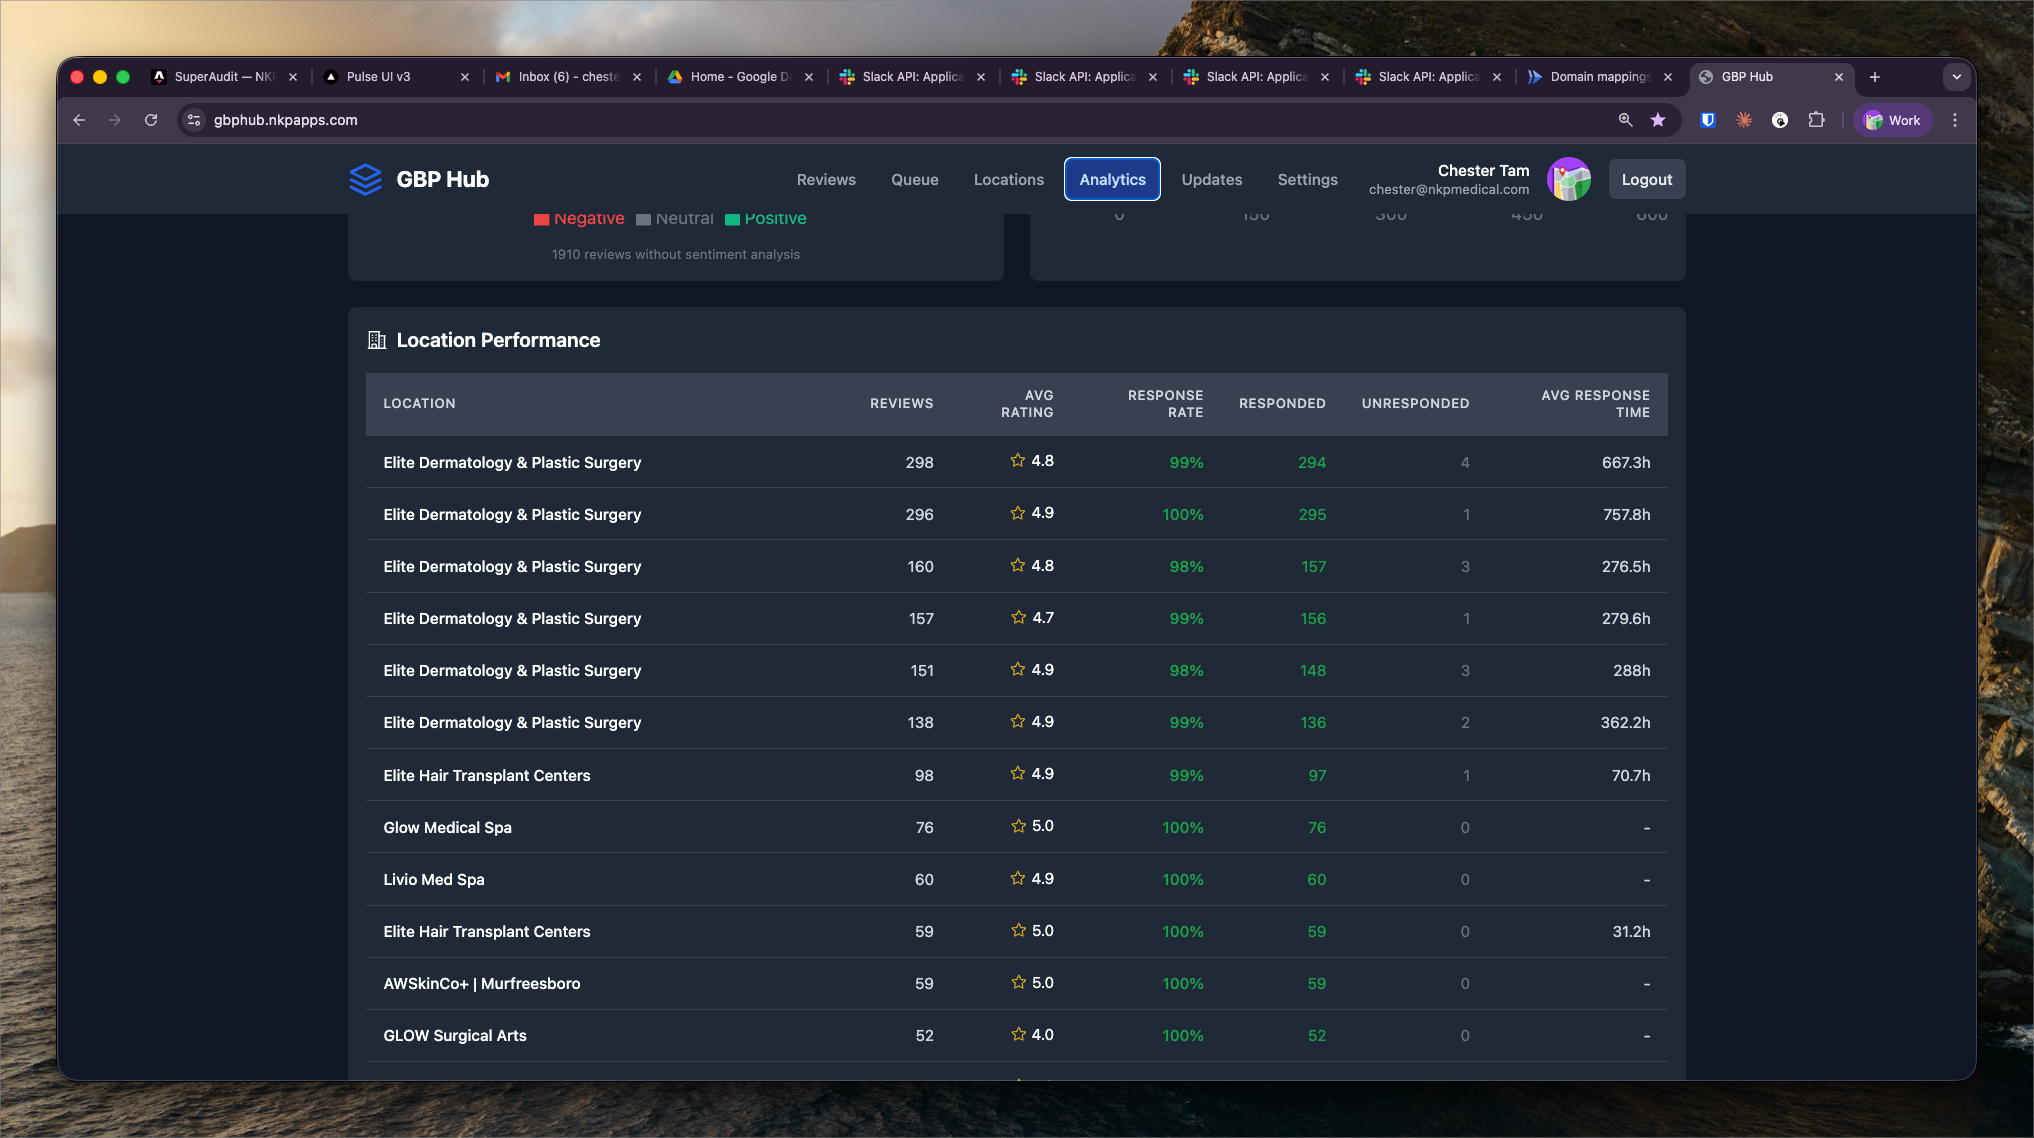
What It Shows
Location Performance drills into the GBP analytics for a single client location. It surfaces the same metrics as Portfolio Analytics but scoped to one location, with trend charts and comparison to the account average.
Per-location metrics:
- Impressions, clicks, calls, and direction requests over time
- Branded vs. discovery search split
- Photo views and upload count
- Rating distribution and review count trend
Comparing Locations
For clients with multiple locations, the location list is sortable by any metric. This makes it easy to identify:
- Which locations are driving the most calls (high performers to model)
- Which locations have dropped in impressions (potential profile issues)
- Which locations have the worst review ratings (triage priority)
Profile Health Indicators
Each location row includes a profile health score based on completeness:
- Business name, category, and description filled
- Primary photo and logo uploaded
- Hours of operation set (including holiday hours)
- Services and attributes listed
- Posts published in the last 30 days
An incomplete profile reduces impressions — Google's algorithm favors complete, active profiles in local pack results.