Command Center
Cross-portfolio operations hub — 266 active accounts with Monday.com completion rate (82.7%), 10,150 open items, comms volume, and activity score in one view.

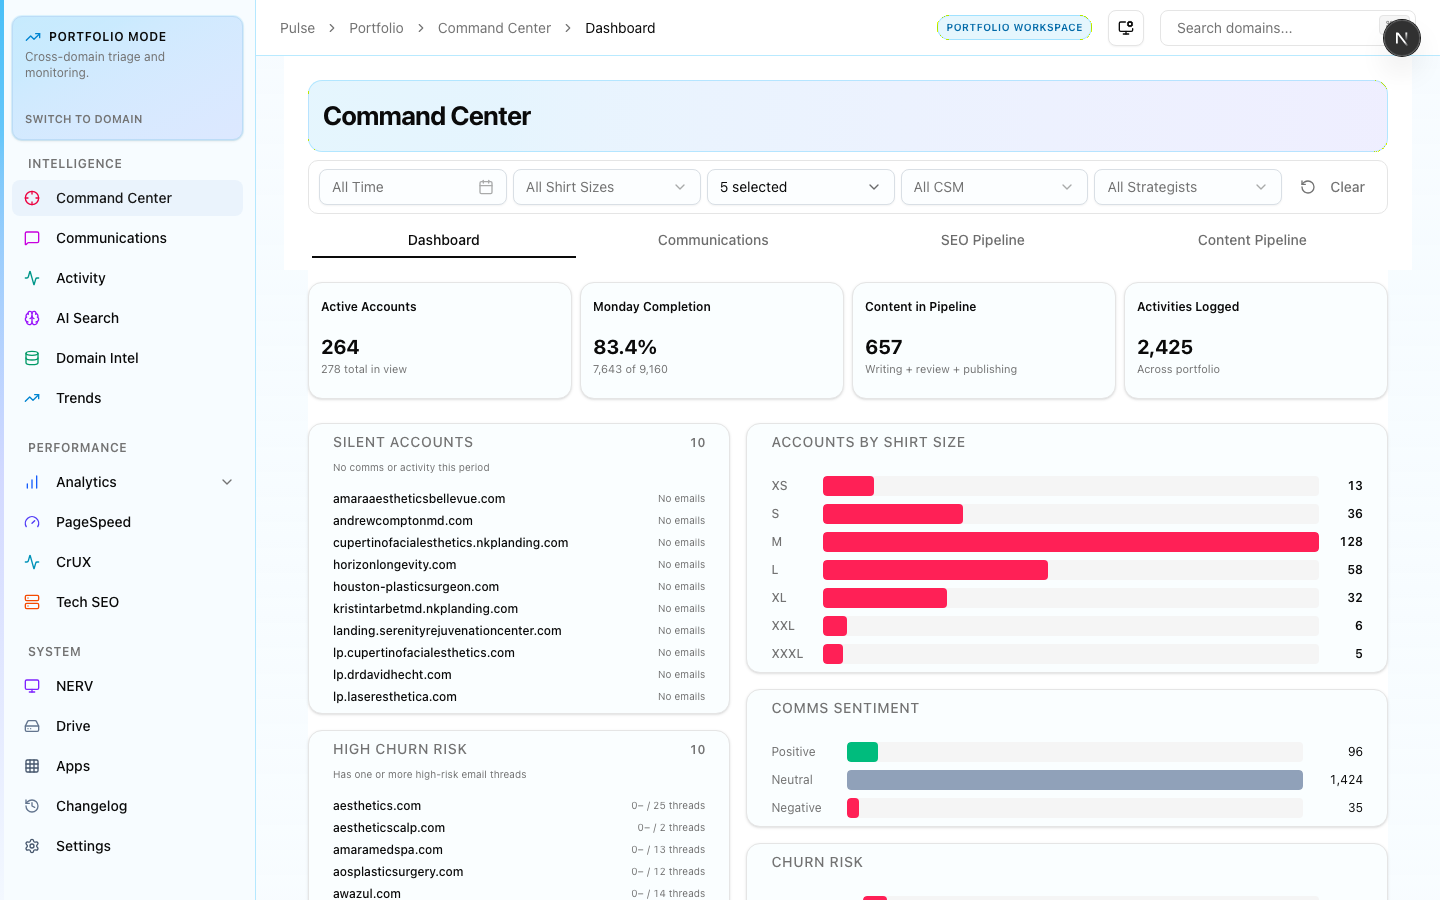
The Command Center is Pulse's primary landing view. It aggregates live operational data across all four pipelines — accounts, fulfillment, content, and communications — into a single row of metric tiles.
Dashboard
The main dashboard shows portfolio-wide KPIs:
- Active accounts — total portfolio size with shirt size distribution (S/M/L/XL)
- Monday.com completion rate — SEO board task completion across all domains. Green = above 80%, amber = 60–80%, red = below 60%
- Open items — total unresolved Monday.com tasks ranked by domain
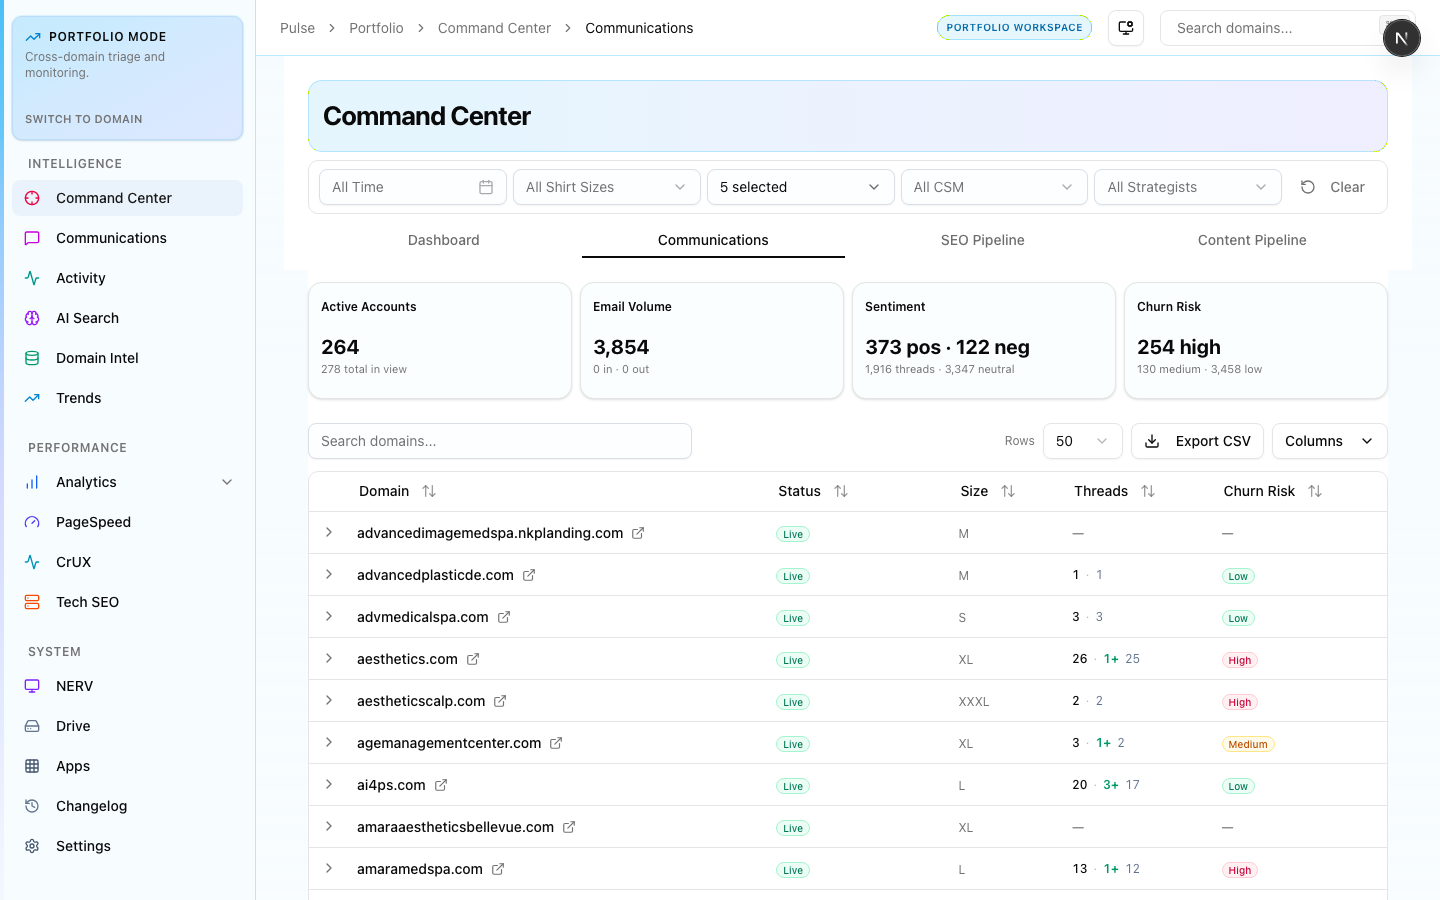
- Comms volume — email thread count from the last 7 days with sentiment flag
- Activity score — composite team activity index (task completions + annotations + content updates)
Clicking any metric tile navigates to the underlying module with filters pre-applied.
CS Pipeline
Client services board showing account status, open tickets, and SLA tracking across the portfolio. Use this to identify accounts needing immediate attention.
Fulfillment Pipeline
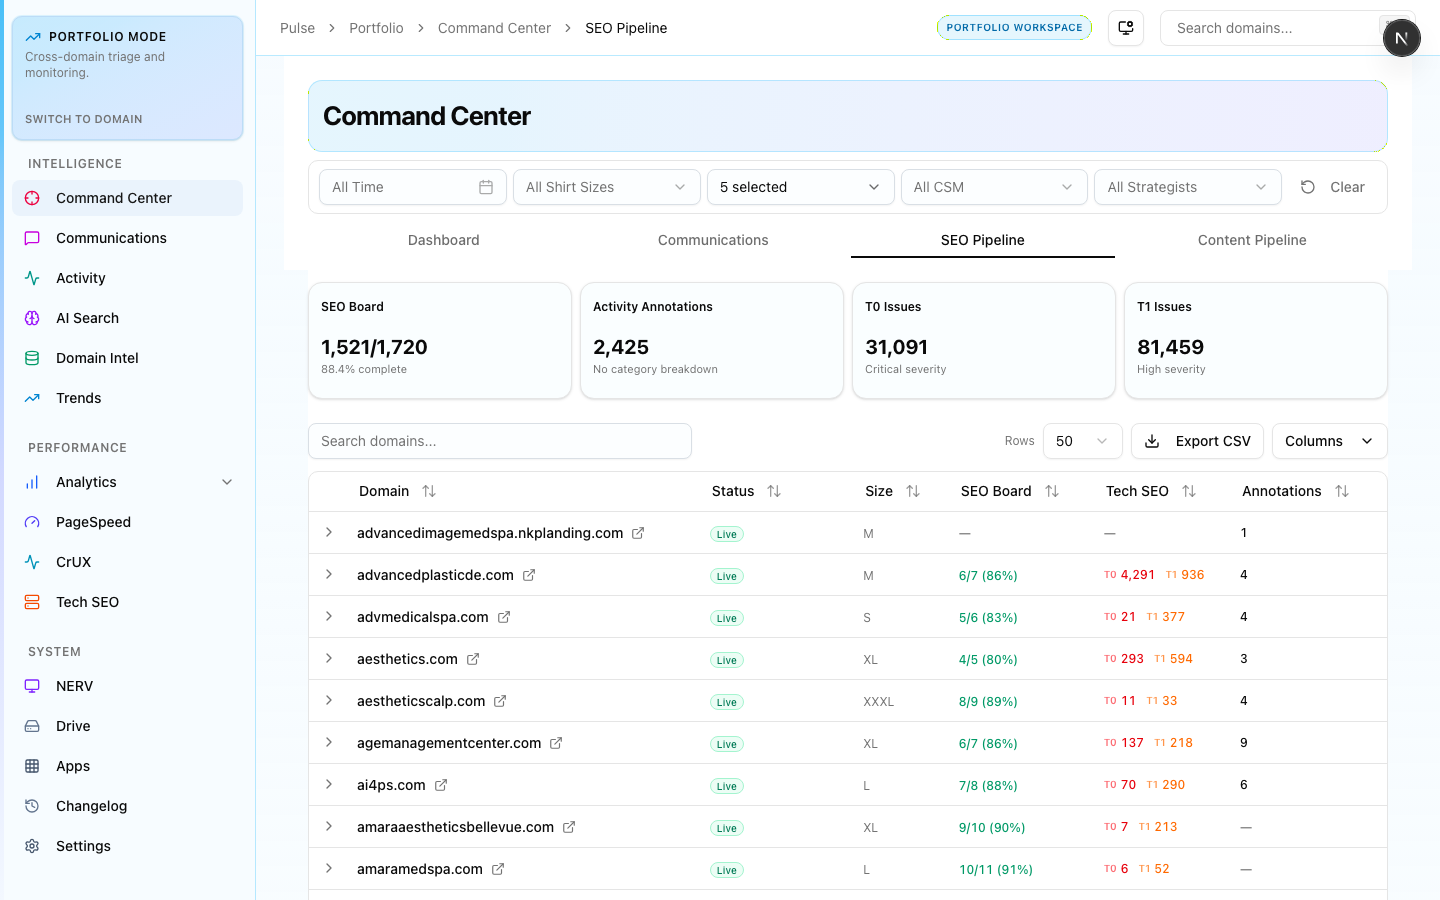
Per-domain SEO fulfillment tracking. Shows monthly delivery progress with task completion rates per account. Use this in weekly team check-ins to spot at-risk deliverables.
Content Pipeline
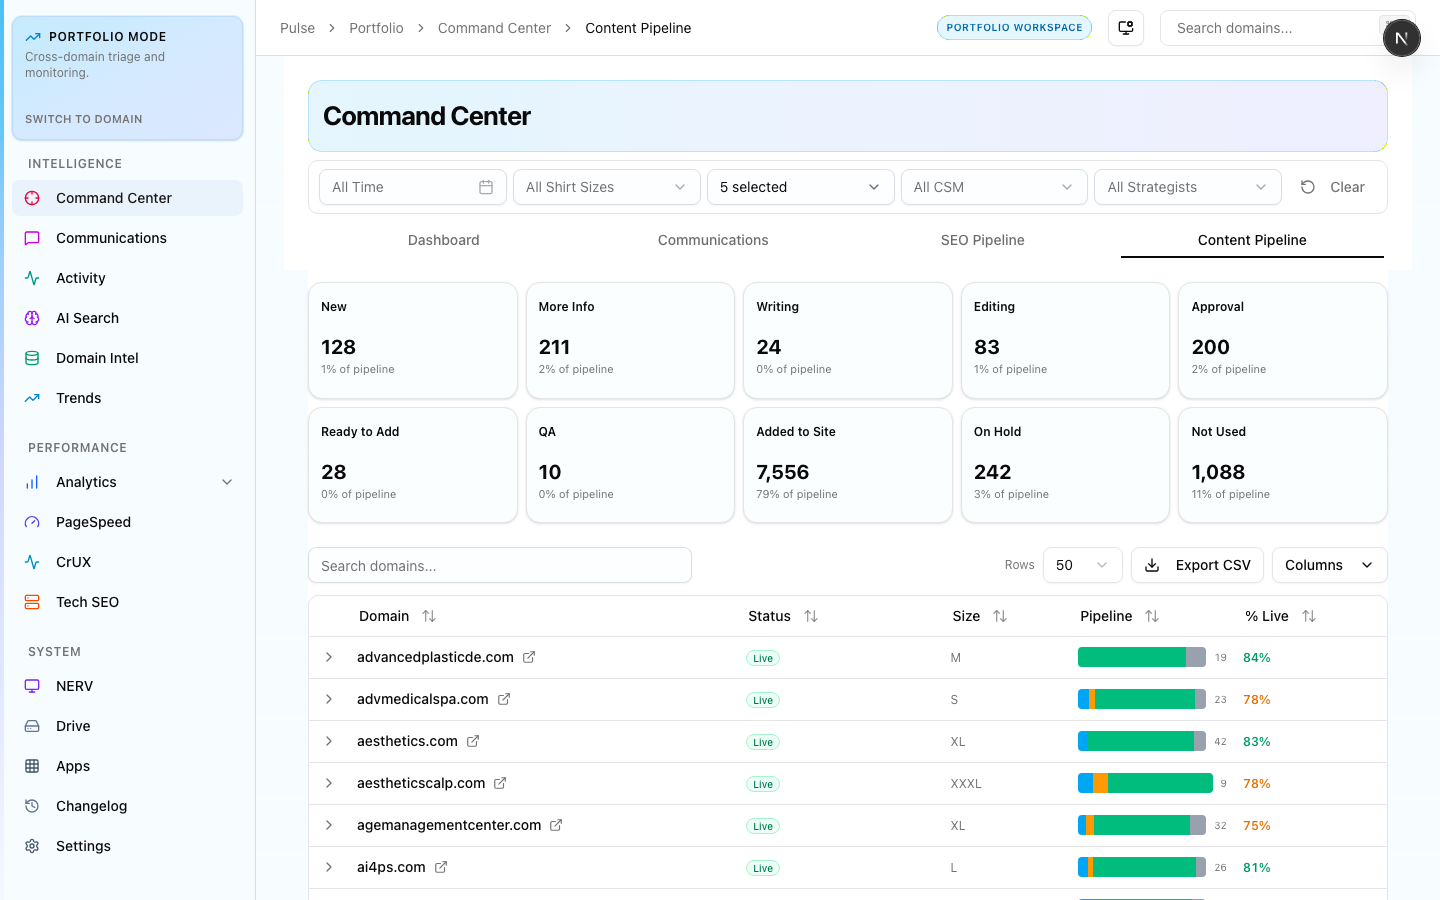
Content workflow stage breakdown — new, needs info, writing, editing, approval, QA. Use this to track content throughput and identify bottlenecks by stage and domain.