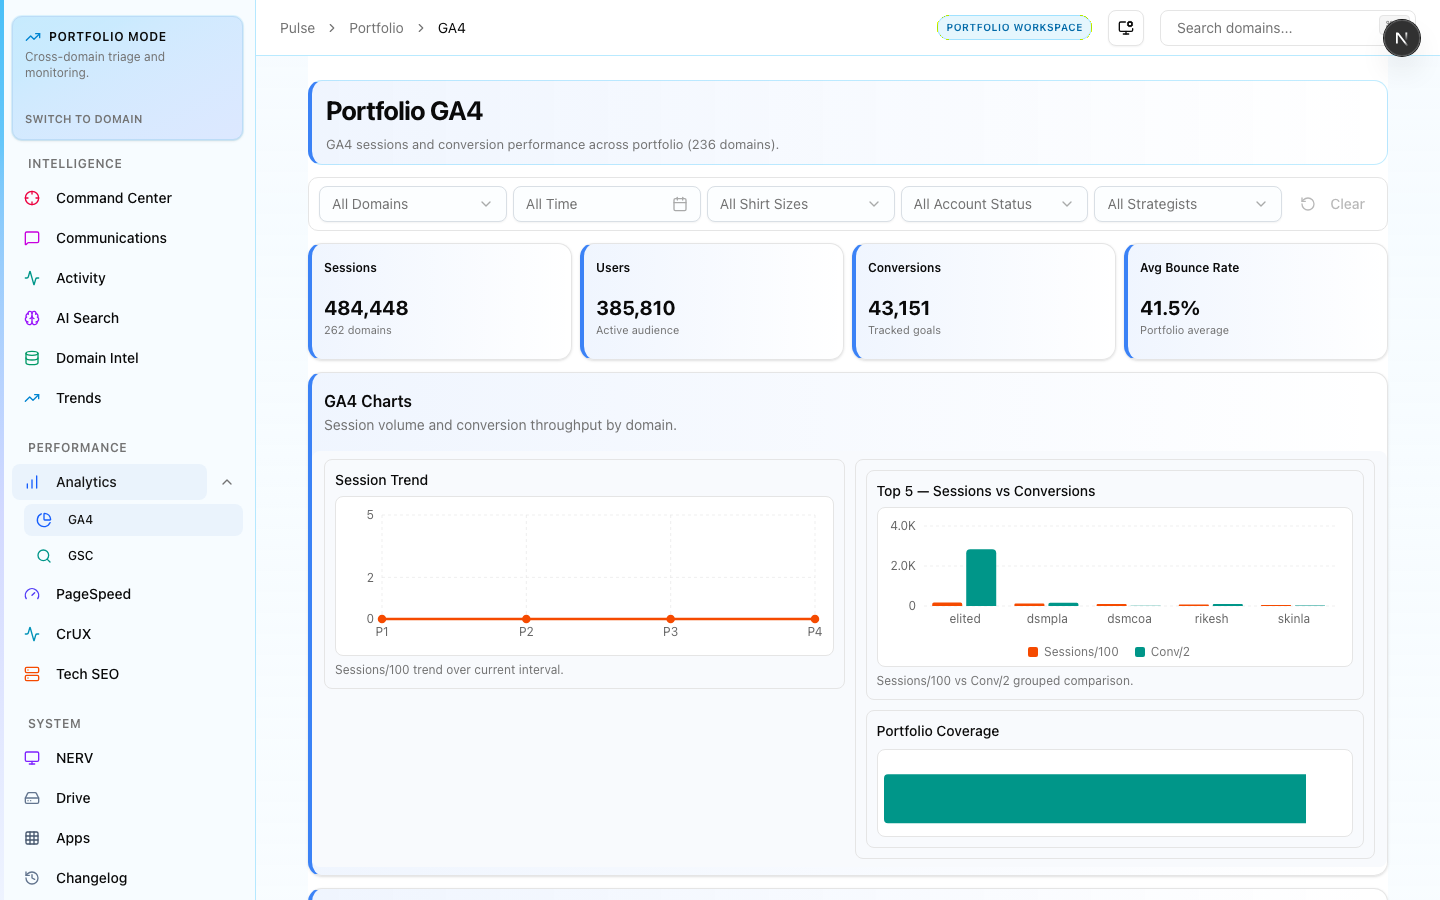
Portfolio GA4 Analytics
484,448 sessions · 385,810 users · 43,151 conversions aggregated across 238 domains. Portfolio session trends, bounce rates, and top-domain conversion comparisons.
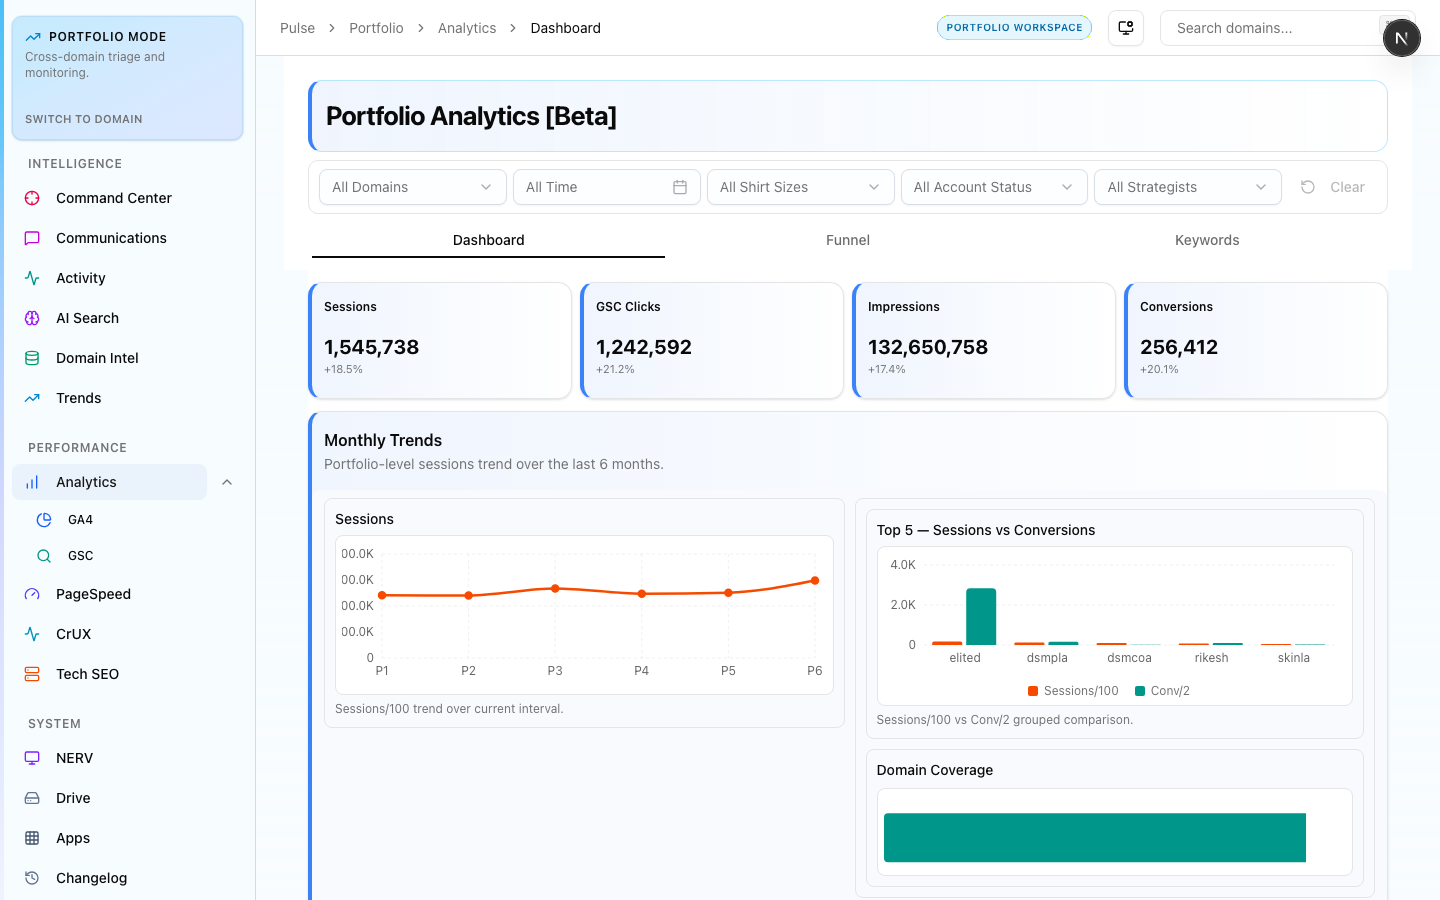
Portfolio Analytics aggregates Google Analytics 4 and Google Search Console data across all connected domains into a single view. Use it to report on portfolio-wide traffic trends and identify outlier domains.
Dashboard
Top-line metrics:
- Sessions — total portfolio sessions for the selected period
- Users — unique user count
- Conversions — goal completions across all domains
- Domain coverage — how many of your accounts have active GA4 connections
The trend chart shows month-over-month traffic movement. Domains with significant session drops are listed in the bottom panel for quick drill-down.
Keywords
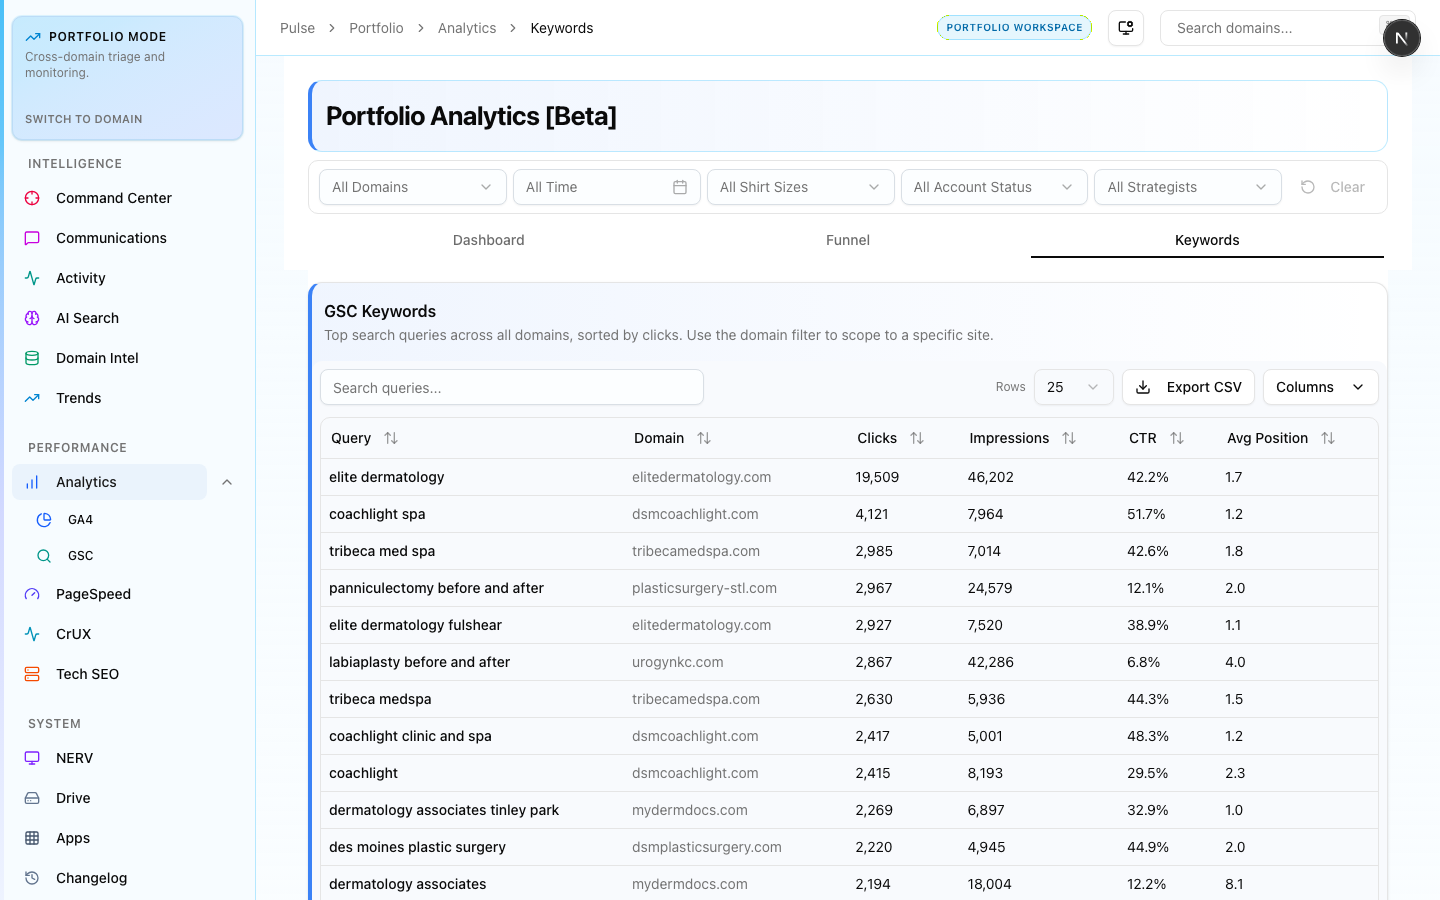
Google Search Console keyword performance table — impressions, clicks, CTR, and average position per query. Filter by domain or keyword group. Use this to track GSC performance across the portfolio without leaving Pulse.
Funnel
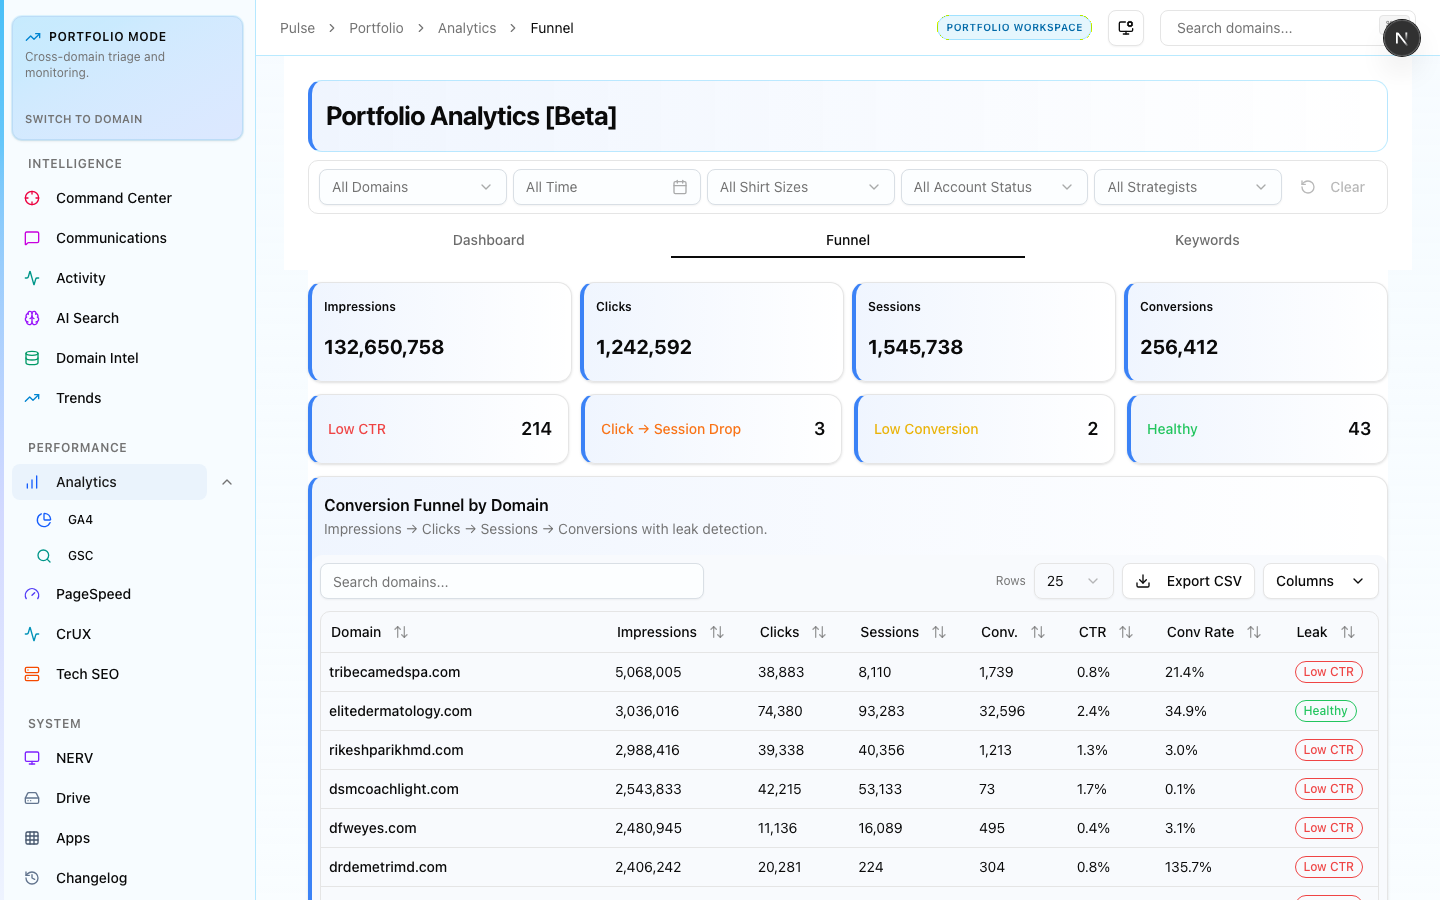
Conversion funnel visualization from session to goal completion. Shows where users are dropping off across the portfolio. Use this in monthly reporting to contextualize conversion rate changes.